I was able to do this in VSCode by following the documentation here: https://code.visualstudio.com/docs/languages/rust#_installation
You need the rust-analyzer extension installed in VSCode.
You'll also need to install one of the debug extensions, I installed CodeLLDB. The VSCode docs say to install that one for MacOS/Linux, and MS C++ Tools for Windows. I only tested on MacOS.
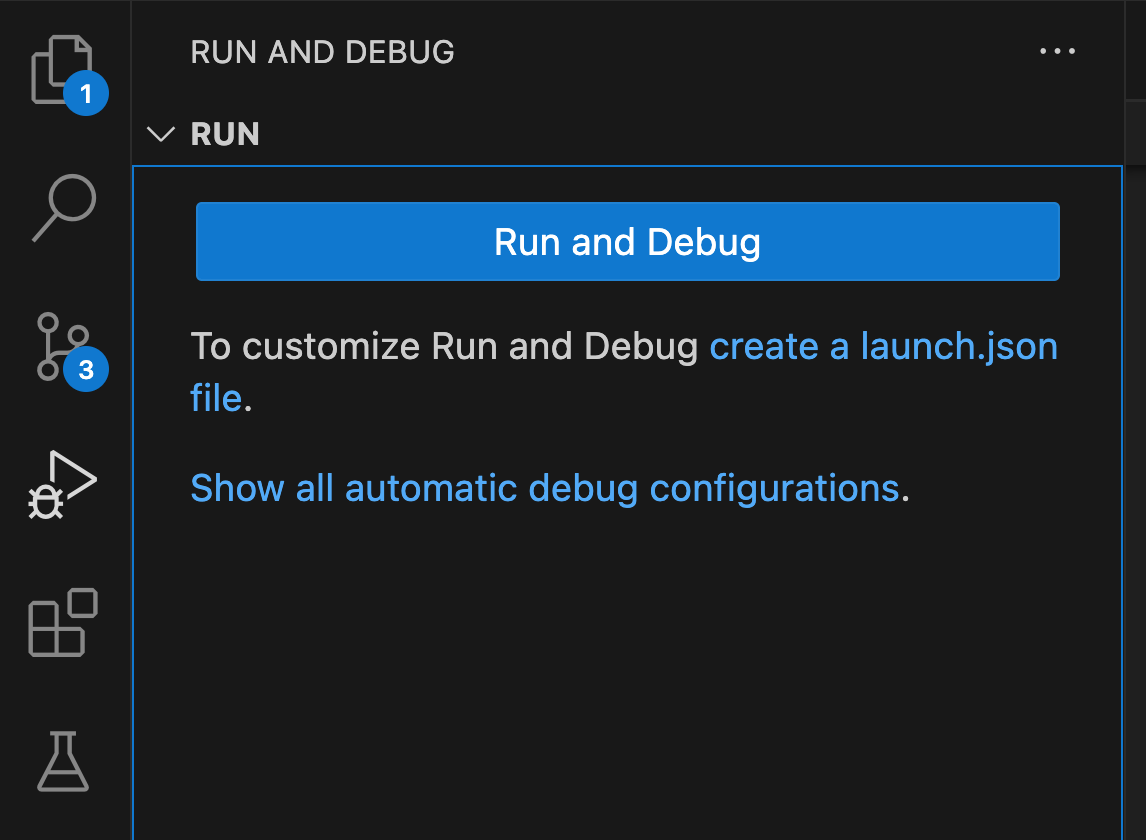
Now go to the "Run and Debug" tab in VSCode, and you'll see a "create a launch.json file" link:

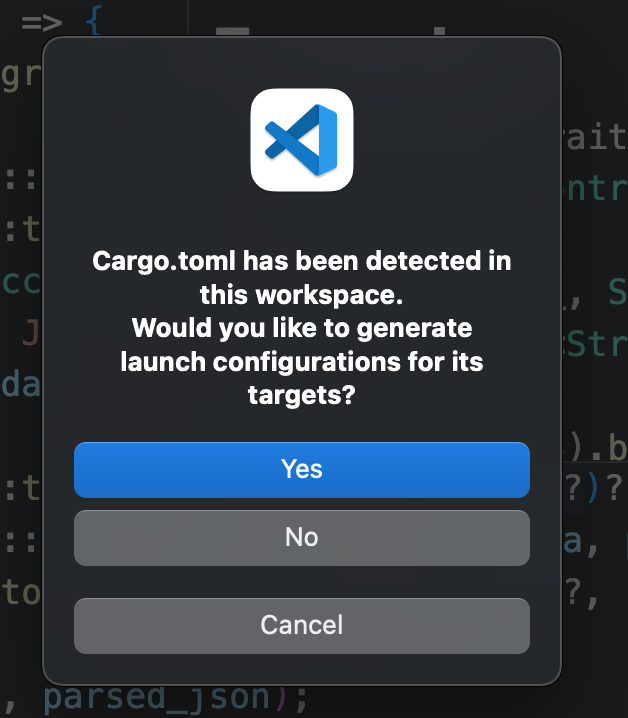
If you click that you should get a popup offering to create launch.json from the cargo.toml file in the repo:

You can do that if you like, but it'll generate a lot of configurations, including eg. one for each set of tests in the repo. You probably don't need that. You can manually create a .vscode/launch.json with the following content:
{
    "version": "0.2.0",
    "configurations": [
        {
            "type": "lldb",
            "request": "launch",
            "name": "Debug executable 'solana-test-validator'",
            "cargo": {
                "args": [
                    "build",
                    "--bin=solana-test-validator",
                    "--package=solana-validator"
                ],
                "filter": {
                    "name": "solana-test-validator",
                    "kind": "bin"
                }
            },
            "args": [],
            "cwd": "${workspaceFolder}"
        },
    ]
}
This task will build the ./target/debug/solana-test-validator binary (and all its dependencies), and then run it. In my case I was running it with ./target/debug/solana-test-validator --account-dir ~/scratch/solana-validator-tokens, so I need to include these arguments. You can do this by modifying args:
"args": ["--account-dir", "/Users/callum/scratch/solana-validator-tokens"],
Note that the ~ shell expansion doesn't work here, you need to give a complete path.
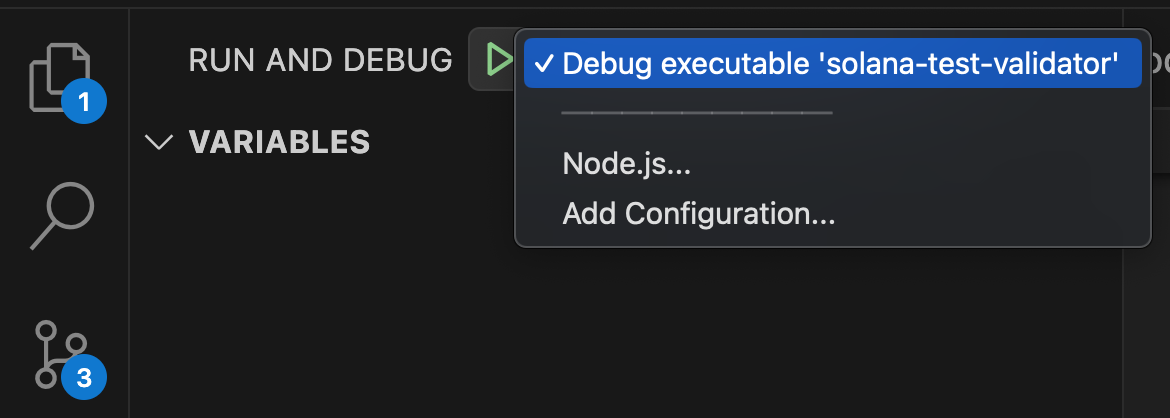
Now you can find and run this task from the Run and Debug UI:

Select it and click the green tick to run. You'll see a cargo terminal option run and compile everything, and then the familiar test validator UI:

Note that ctrl+c in that terminal window doesn't seem to work. Use the Stop button in the floating debug controls instead:

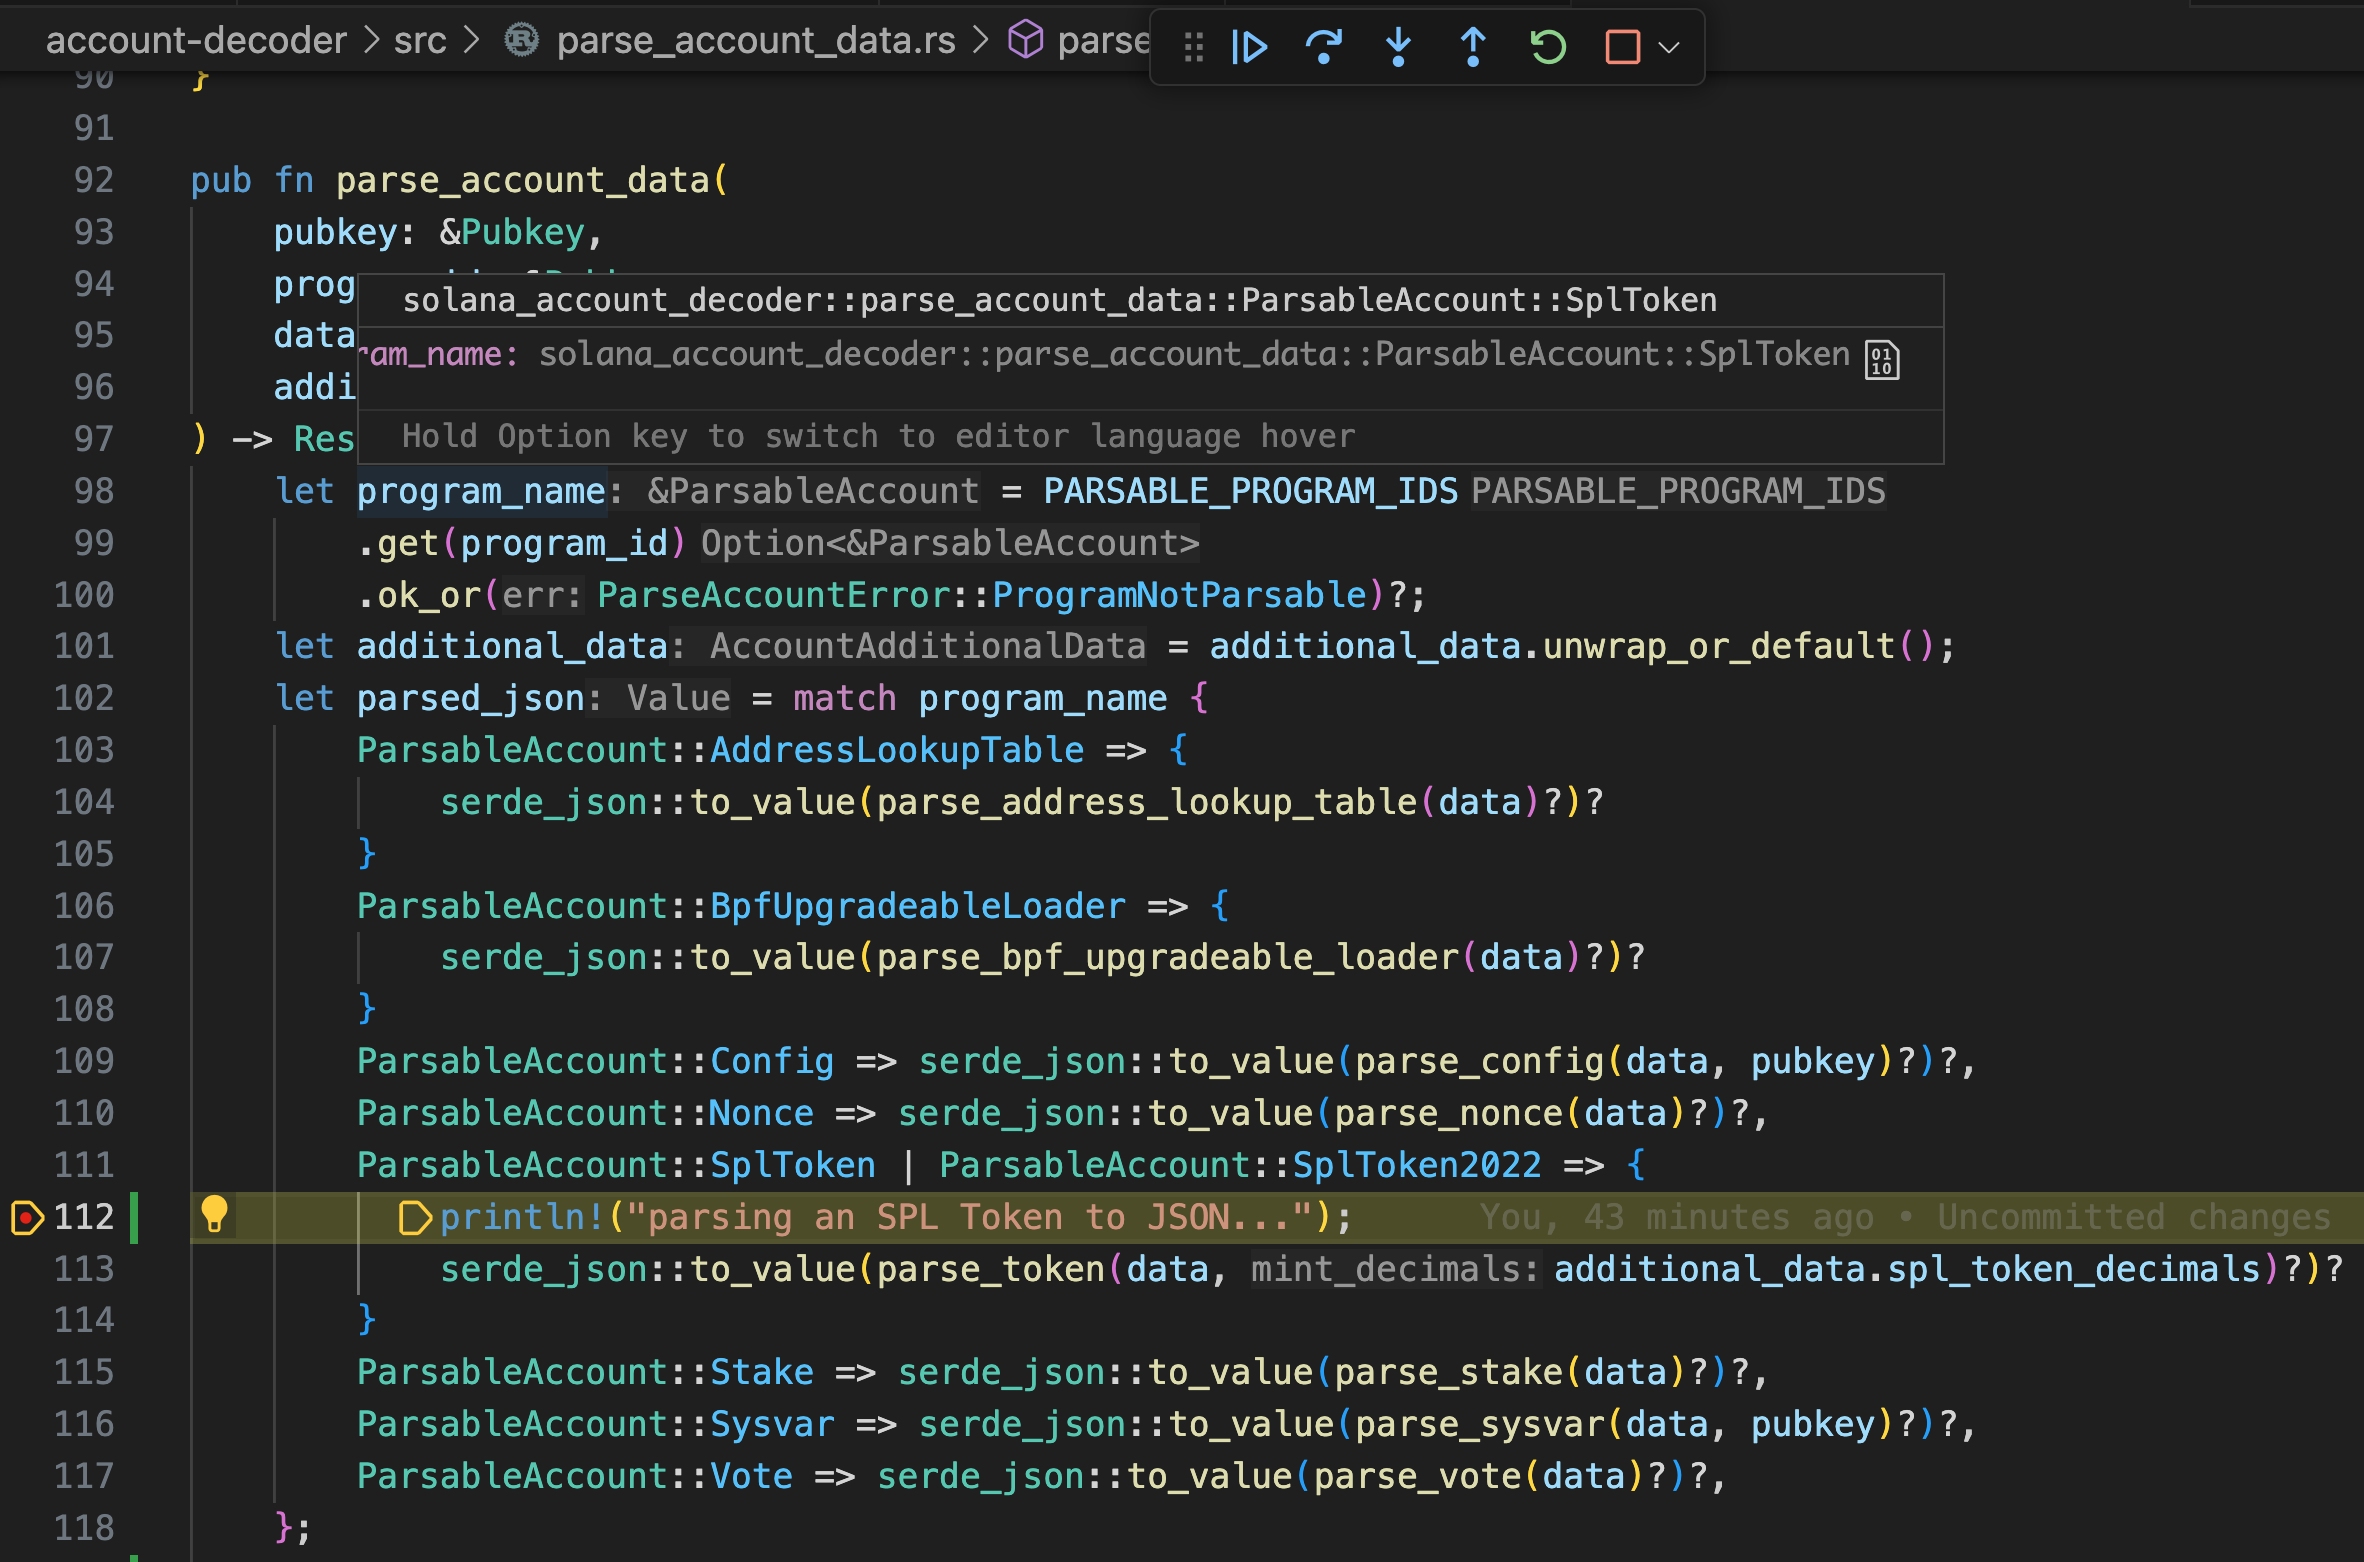
And now when you interact with the test validator, for example by making RPC calls, breakpoints in VSCode will work. You'll also get debug access to variables etc:
